Slope measures the rate of change of elevation of a surface. Slope maps are used by architects, landscape planners, hydrologist in designing structures and predicting water flow. It is also used as a criteria in many Multicriteria Decision Analysis(MCDA) for suitability analysis like Landfill site selection, Landslide hazard zoning and has wider applications.
The main objective of this tutorial is to learn technique of generating slope from DEM. After getting slope we will also reclassify slope. We are going to do this in QGIS.
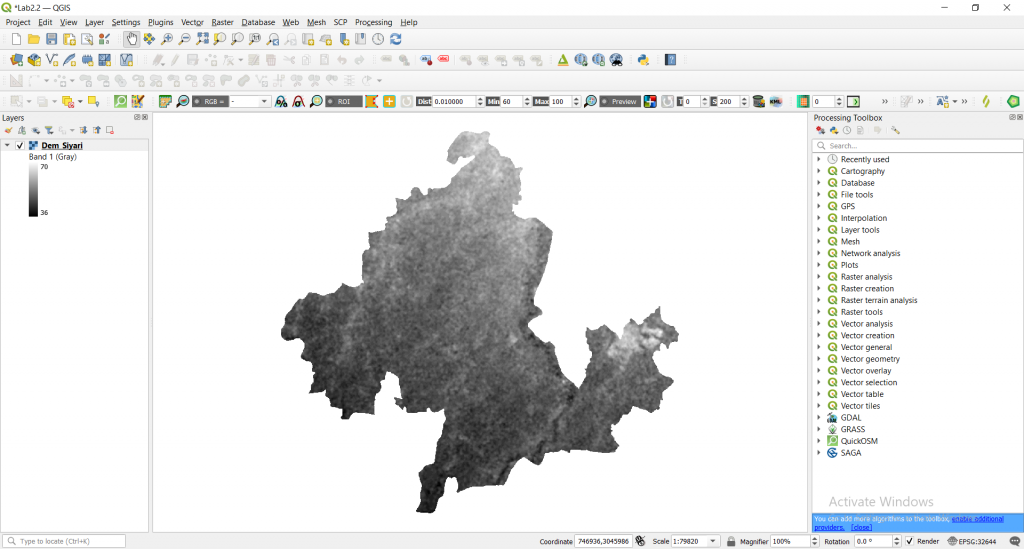
Step1: Load ‘Dem_Siyari’ data in your QGIS layer panel as shown in figure below.
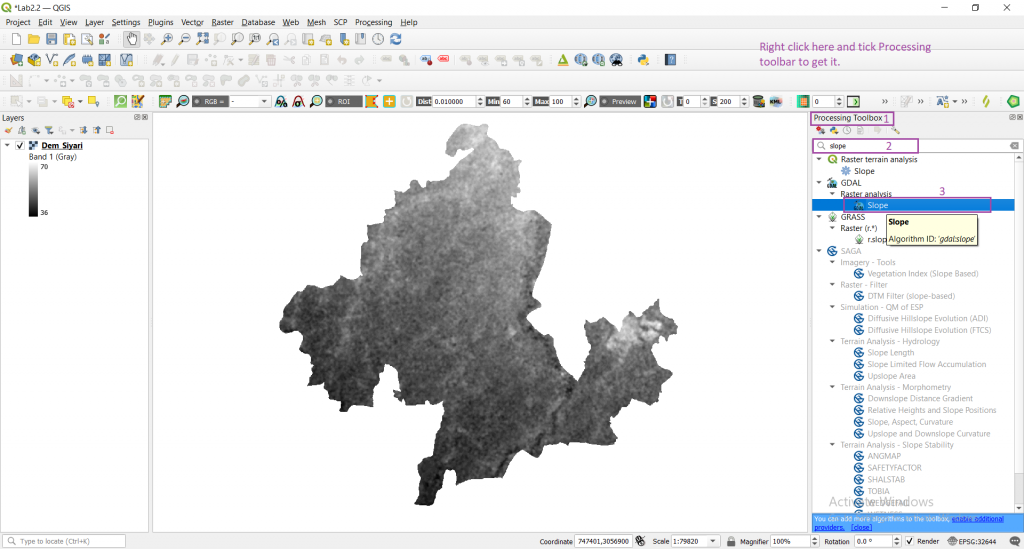
Step2: Go to Processing toolbar -> search for ‘slope’ -> click Slope which is below Raster analysis under GDAL section.
Right click top right white bar to get Processing Toolbar incase you don’t have it.
A window will be displayed like this.
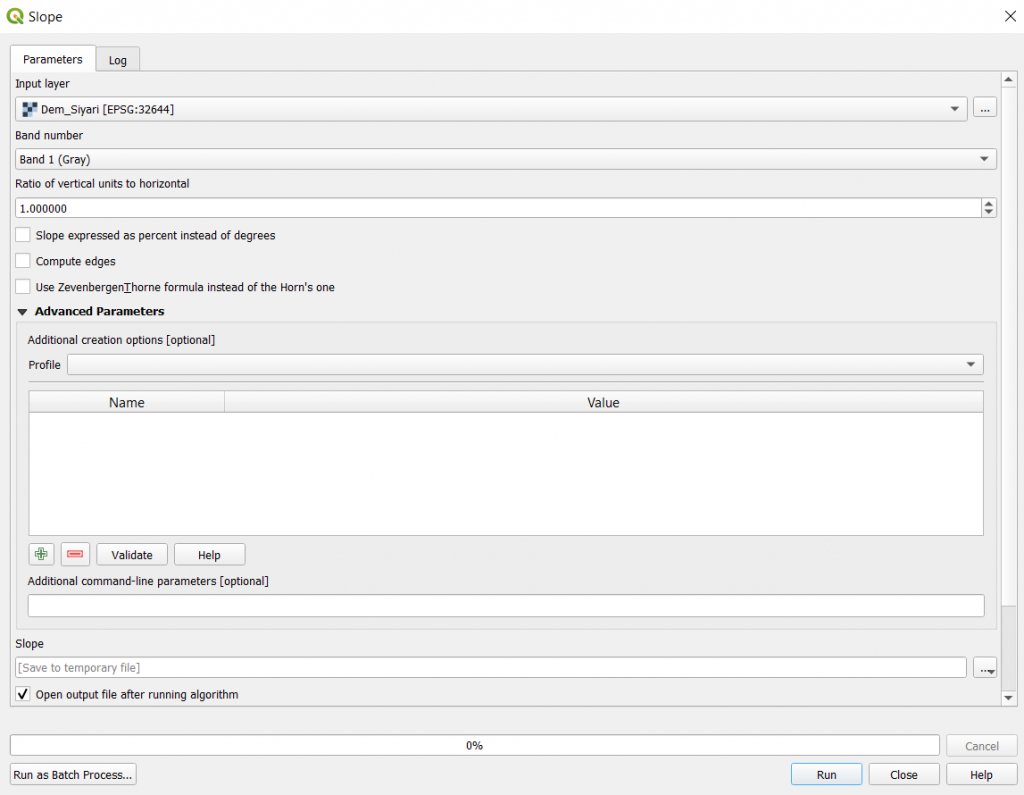
Now adjust the following settings parameter
Step3: Keep Input layer as ‘Dem_Siyari’, Save it to a file by clicking three dots icon in your desired directory with filename ‘Slope’ and finally click Run.
If you want slope in percent then you can tick that option shown in parameter else your output will be in degree.

If everything goes right you will see following output.
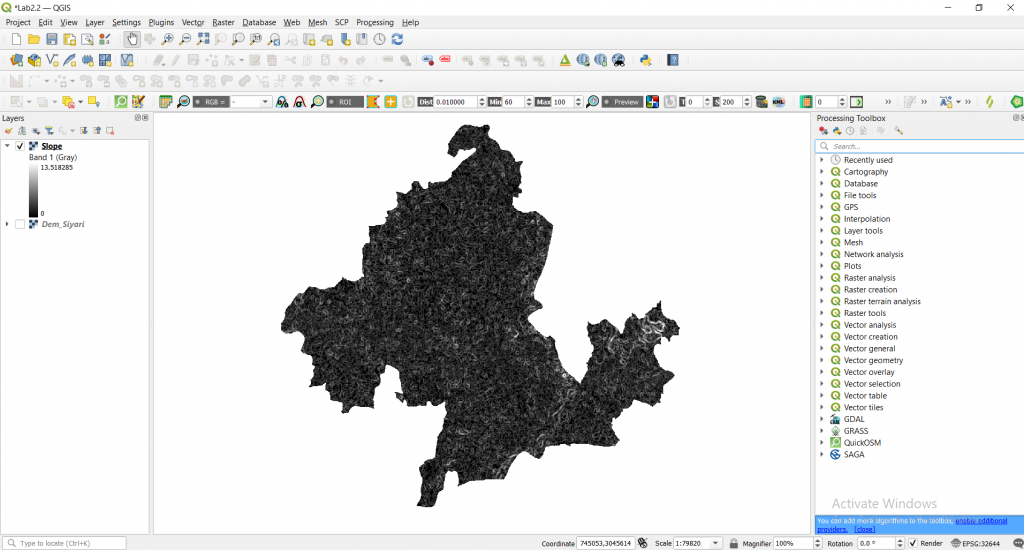
Reclassifying the slope
The slope is not ready for analysis yet we need to reclassify it according to purpose of analysis.
To make things simple we will classify our slope into four categories <5, 5-10, 10-20 and >20 degree.
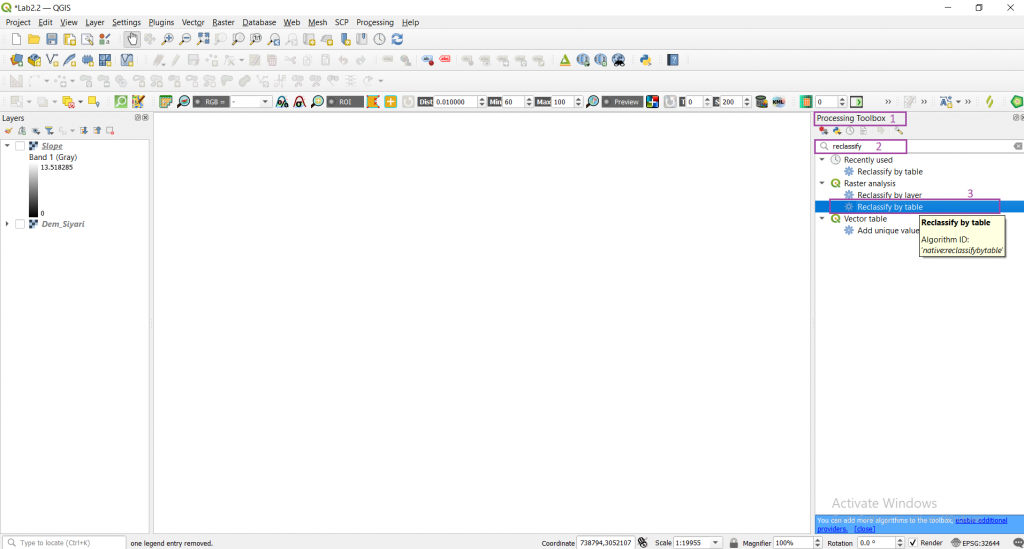
Step1: Go to Processing toolbar -> search for ‘reclassify -> click ‘Reclassify by table’ which is below Raster analysis.
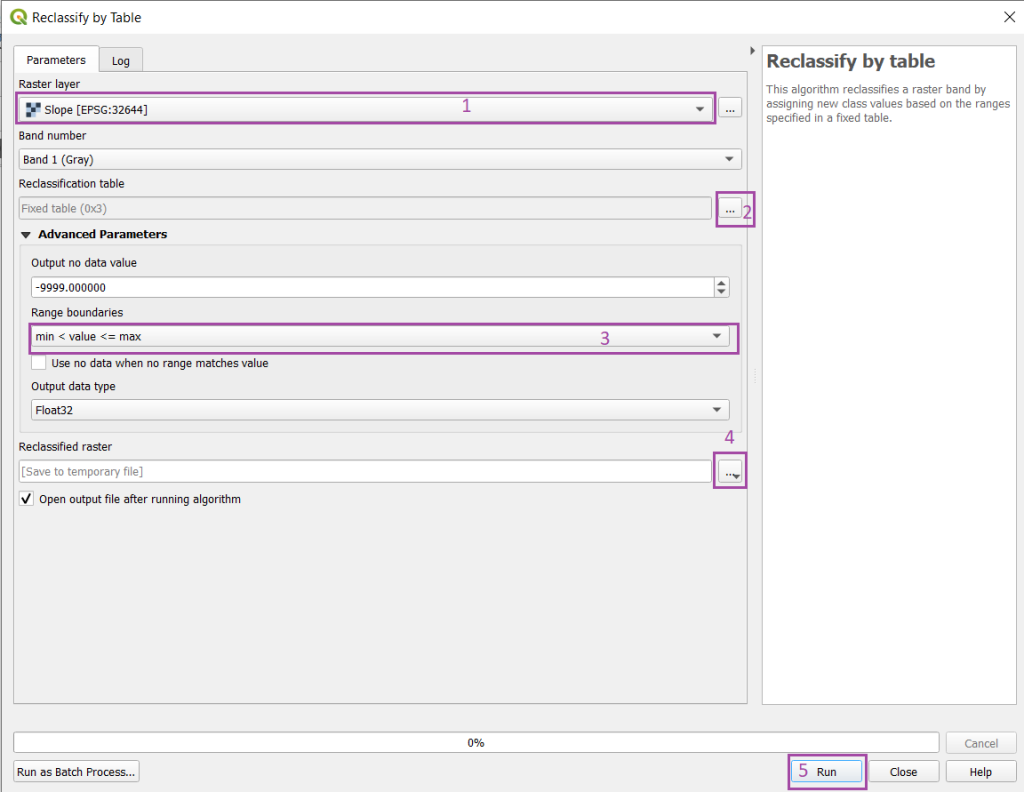
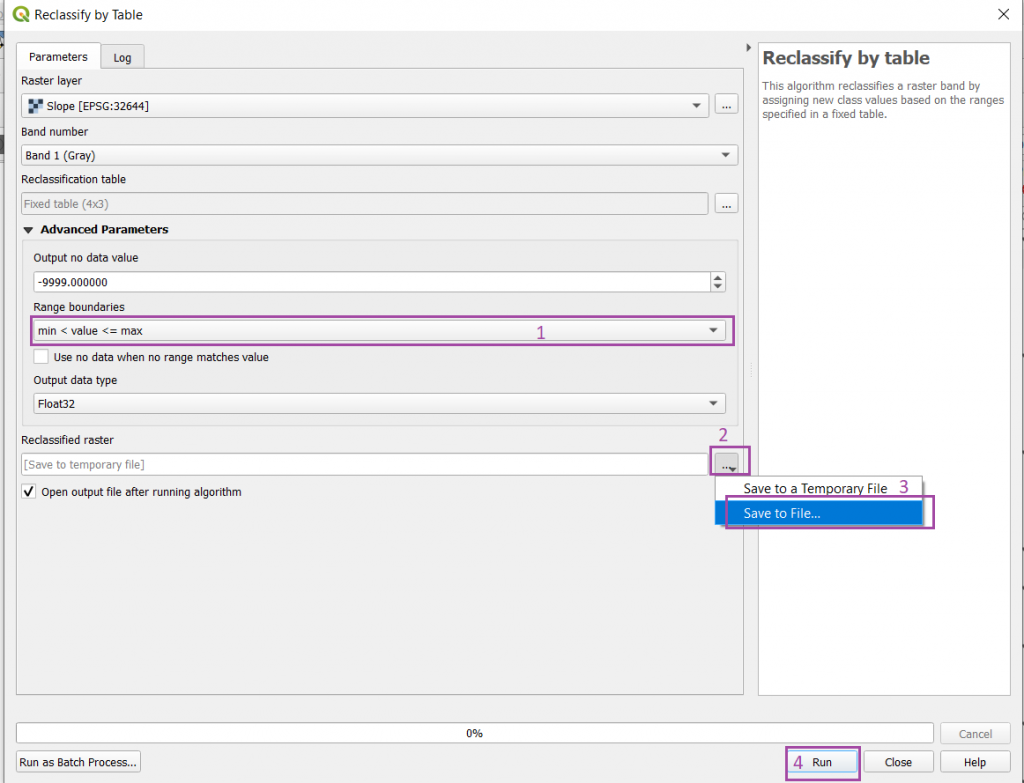
A window will be displayed like below where you have to adjust few parameter settings.
Step2: Keep Input layer as ‘Slope’, click three dots icon under Reclassification table.
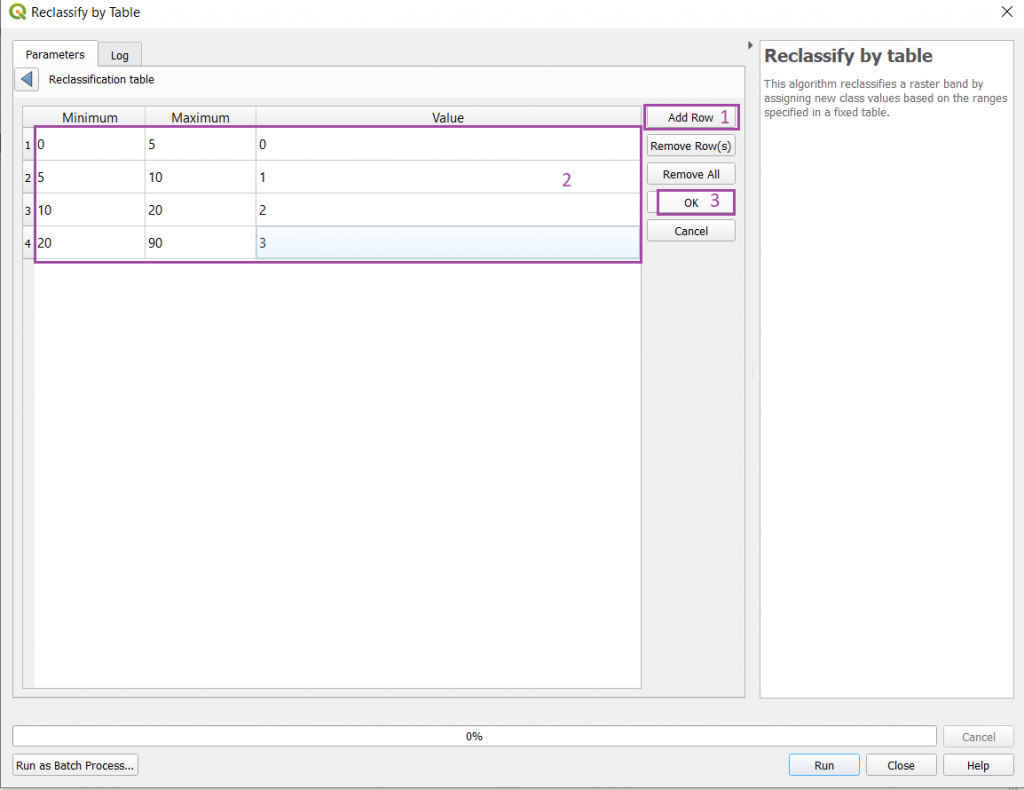
A window will be displayed like this.
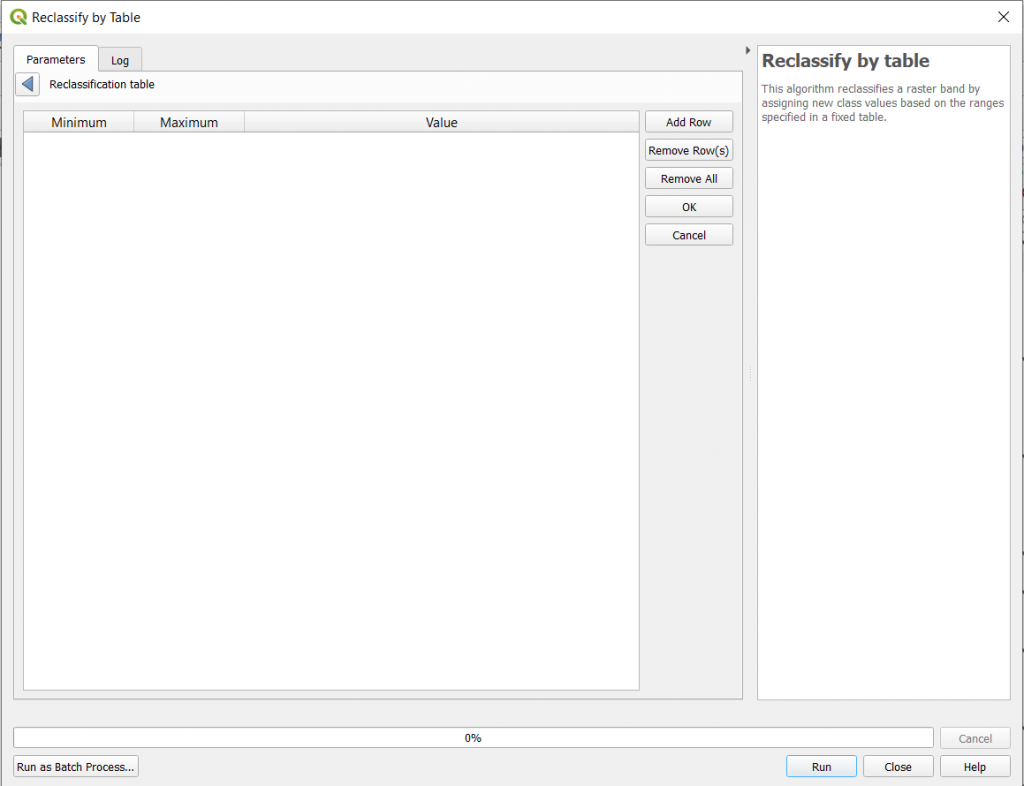
Step2.1: Click on Add row option 4 times to get 4 row and input the values as shown below and finally click ok.
Step3: Keep range boundaries as default, save it to a file by clicking three dots icon in (Lab2.2/ Output) with filename ‘Reclassify_Slope’ and finally click Run.
If everything goes right you will see following output.
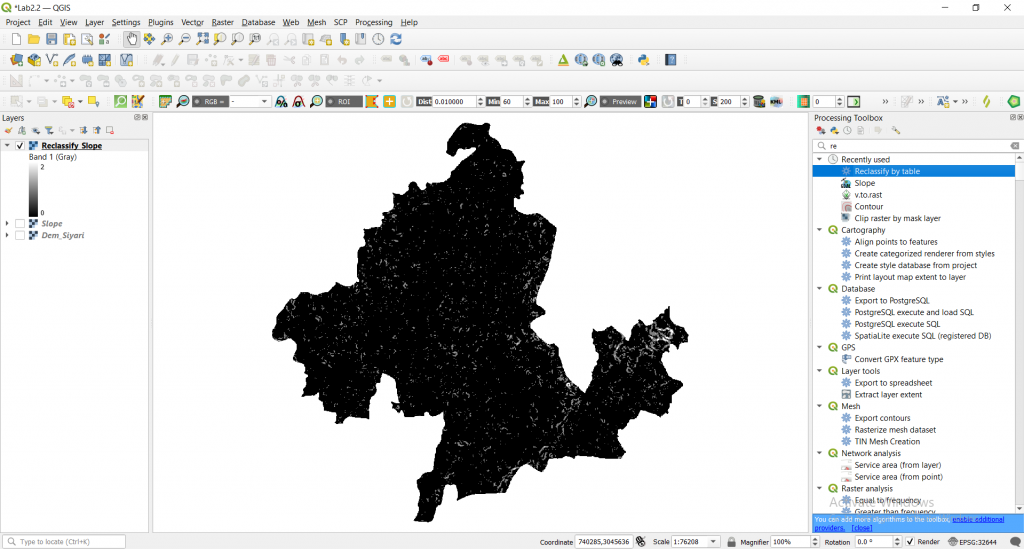
This is not the reclassification that we exactly wanted since the values of ‘Reclassify_Slope’ should have been shown from 0 to 3 as we have given input in ‘Reclassification table’. Now we will change max value of 2 to 3 it by going to Symbology and make our Slope colorful.
Symbology settings
Step1: Double left click ‘Reclassify_Slope’ -> Symbology
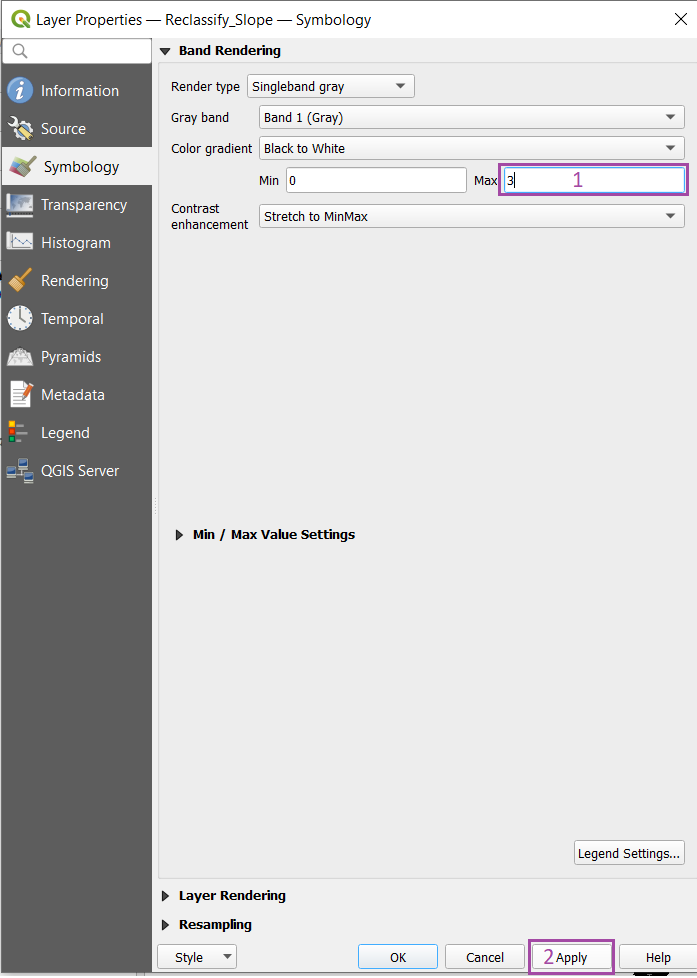
You will see window like this.
Step2: Change Max value to 3 and click Apply.
Step3: Symbology -> choose ‘Paletted/Unique values’ as Render type -> Classify -> Apply
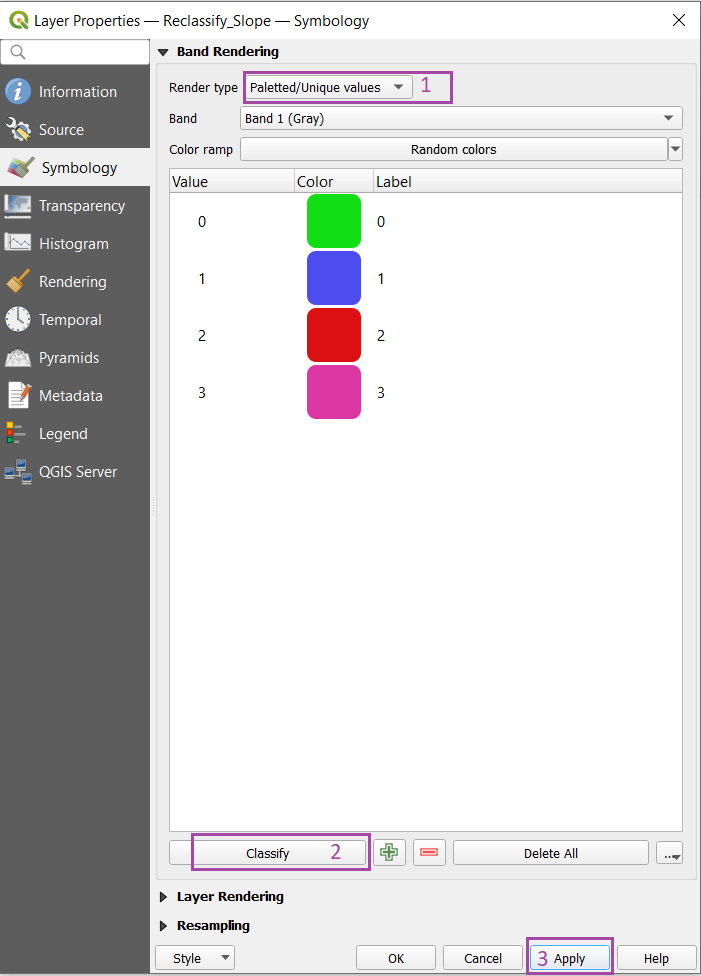
If everything goes right you will be following output.
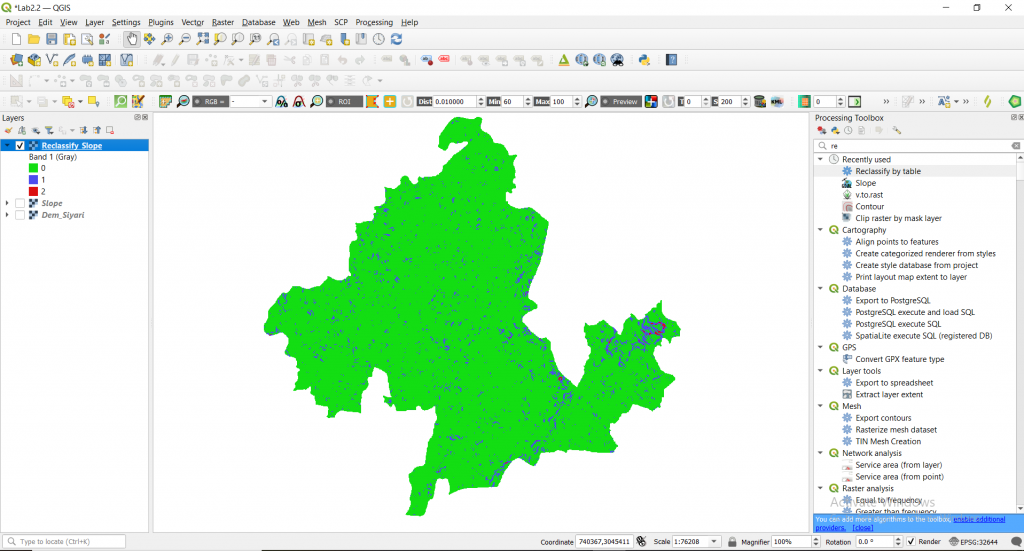
Here 0 means slope <5 degree, 1: slope between 5-10 degree and 2: 10-20 degree.
Note: You may see less values after classification of Platted/Unique values in Symbology than you inserted in Reclassification table. This happens when your data has not such range of elevation.